Policy · 2021–2024
Urban Expansion of the Judicial Facilitators Program
A geospatial prioritization model to extend judicial access into cities.
As Senior Policy Analyst at Costa Rica’s Judicial Branch, I managed the full project lifecycle for the expansion of the National Judicial Facilitators Service into urban areas, a complex multi-site initiative requiring close coordination across institutional hierarchies and geographies. I led planning sessions to design the expansion framework, developed and validated a set of performance indicators, and built individual work plans with each participating court to ensure local ownership and alignment with national targets.
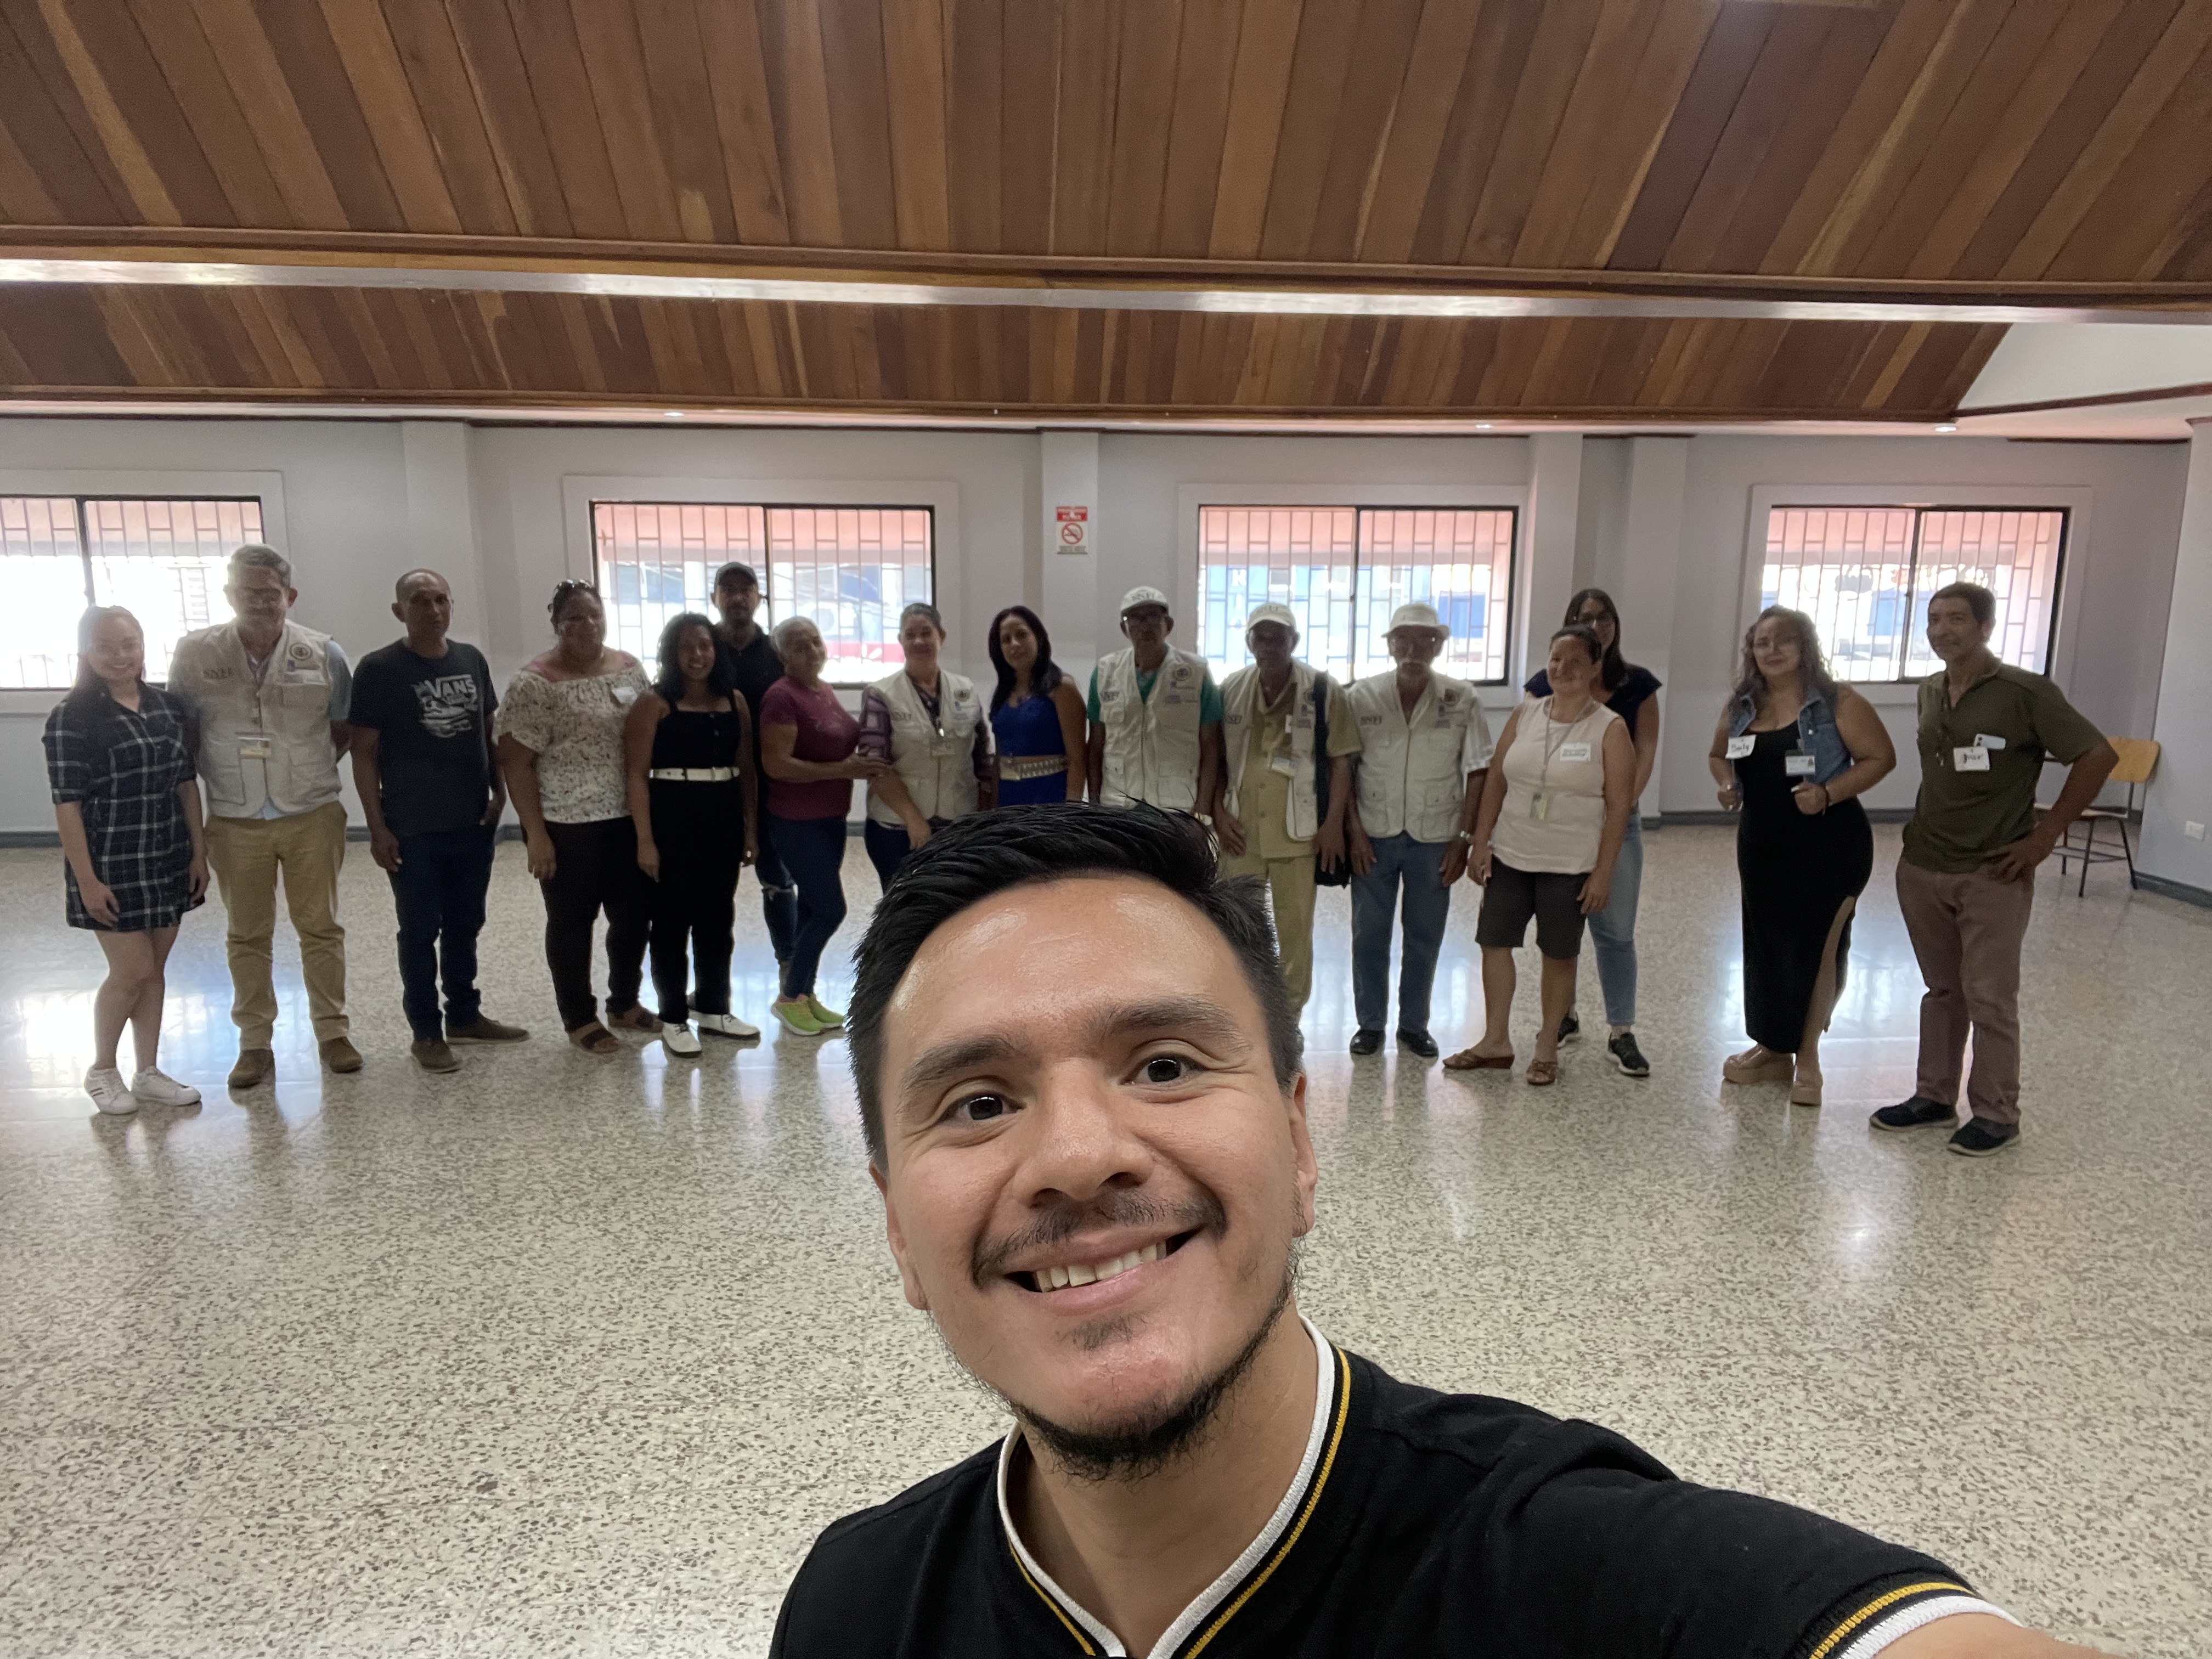
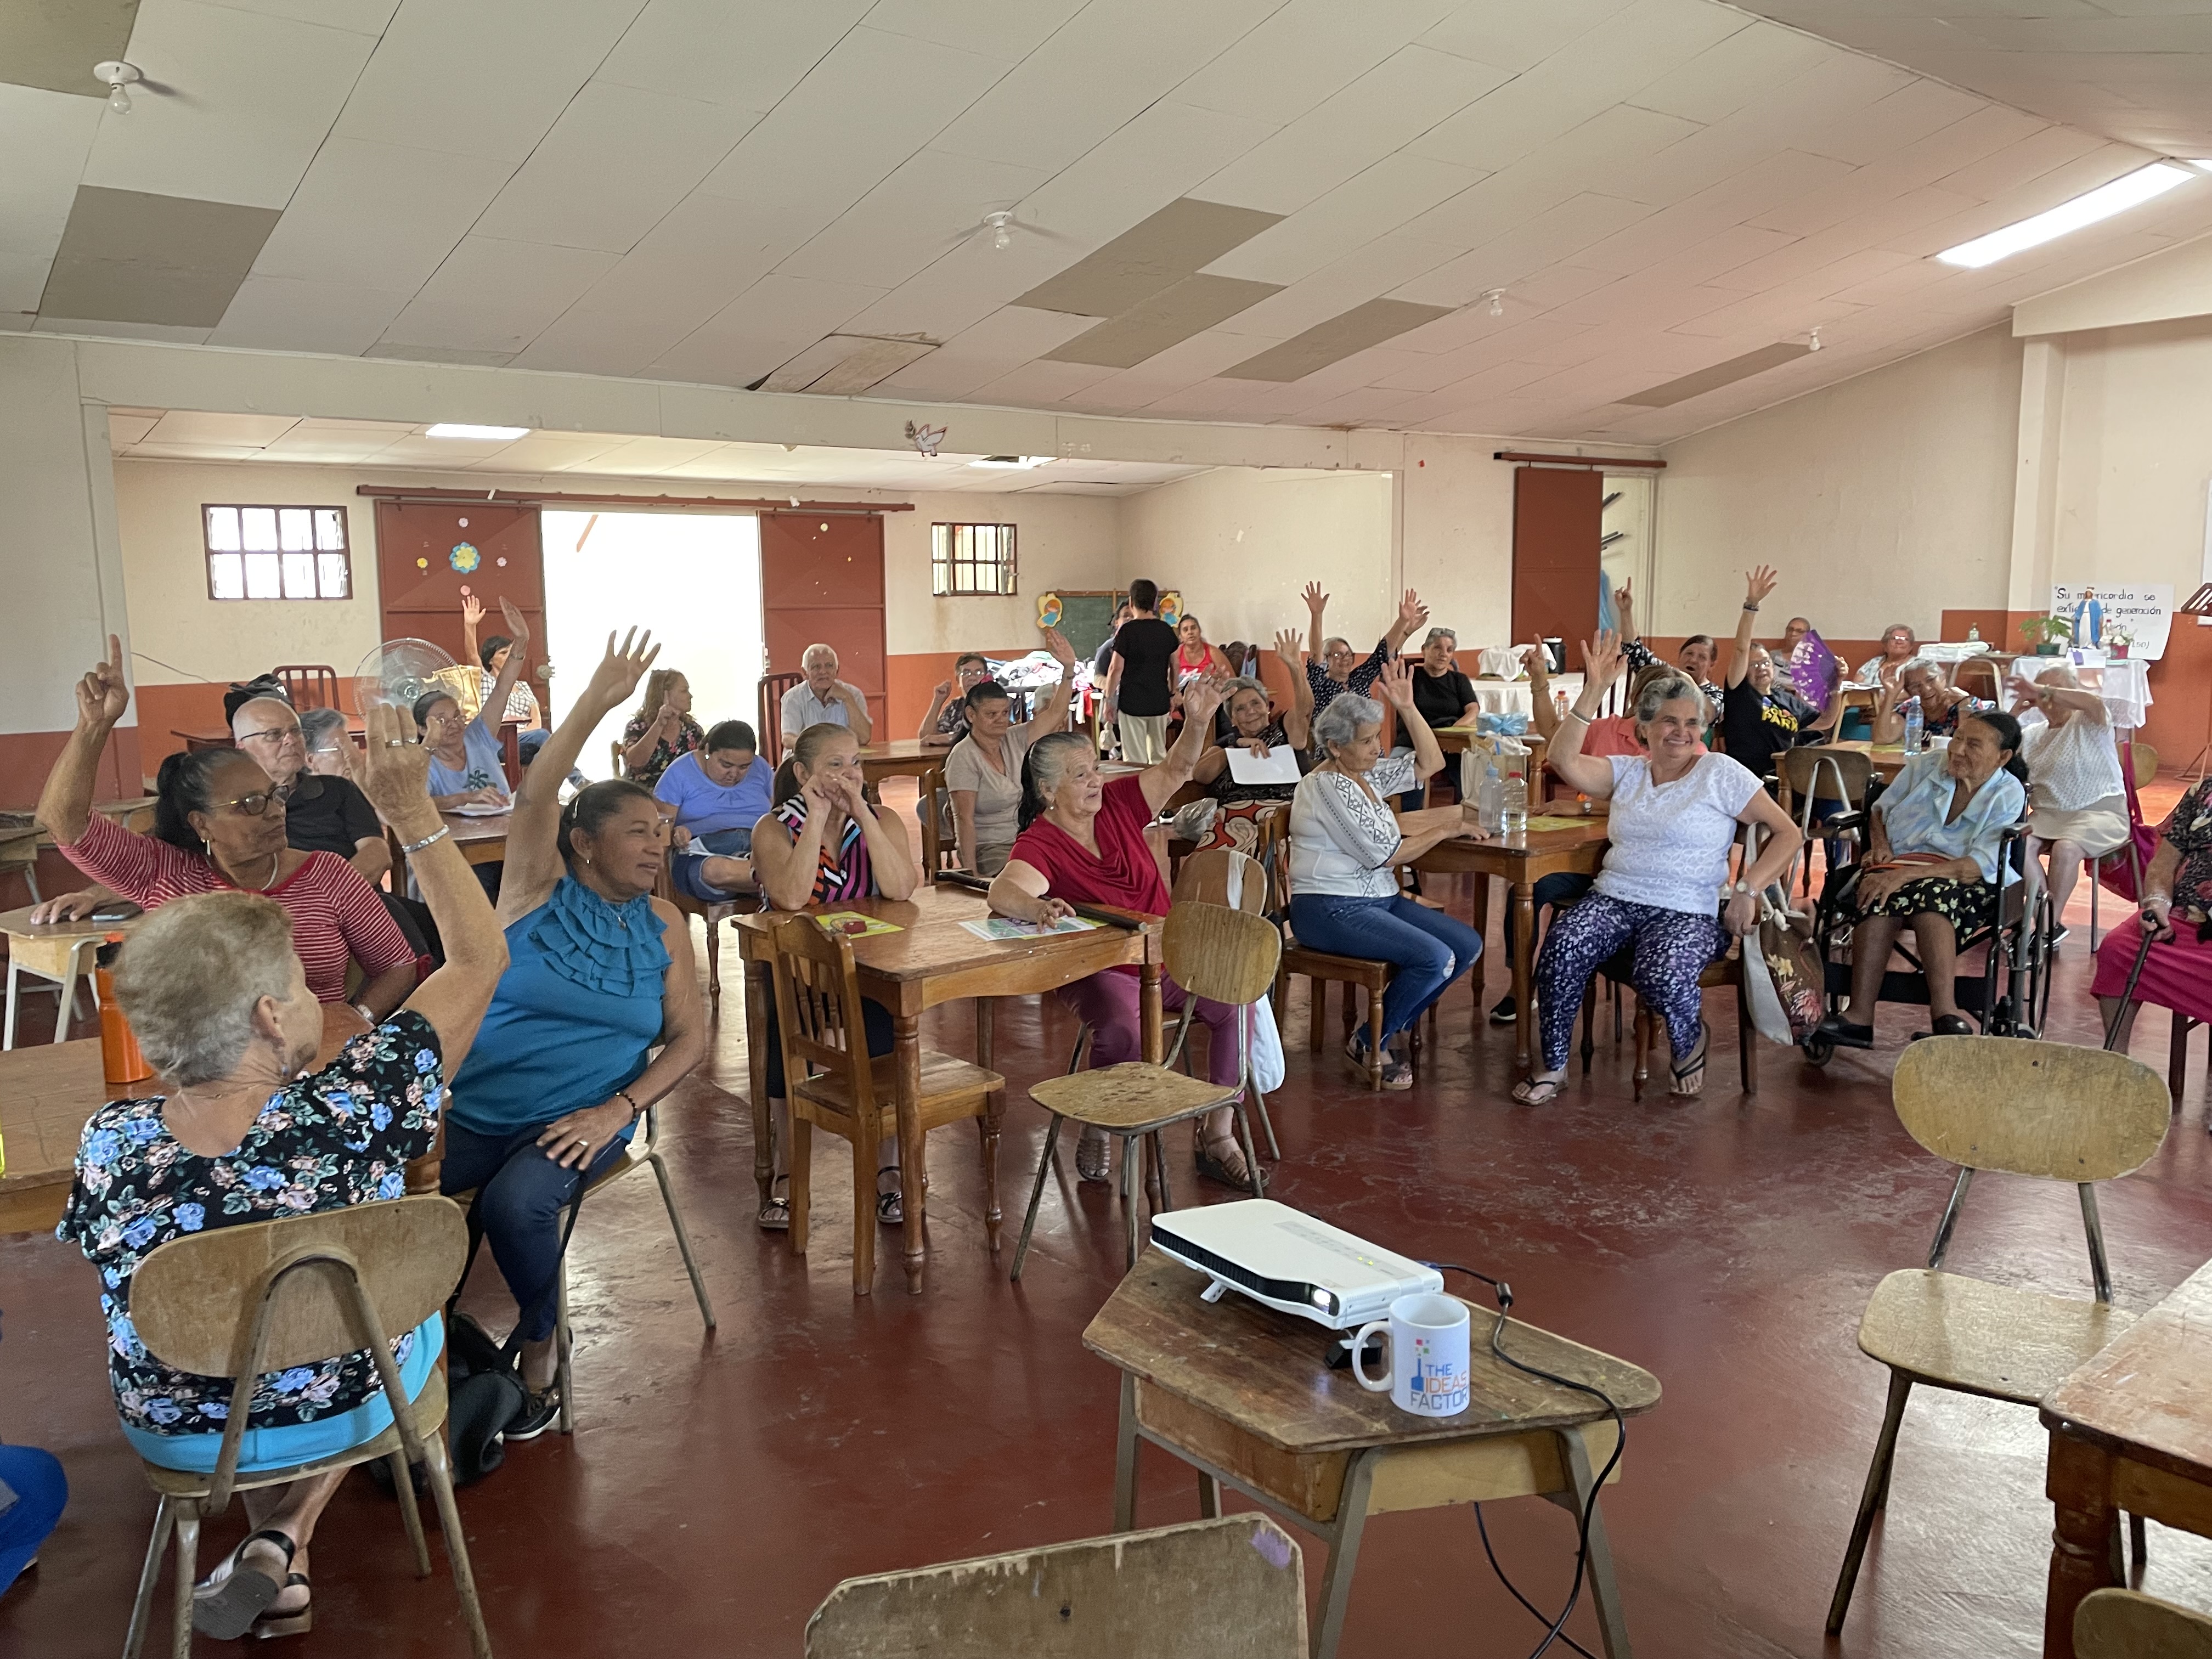
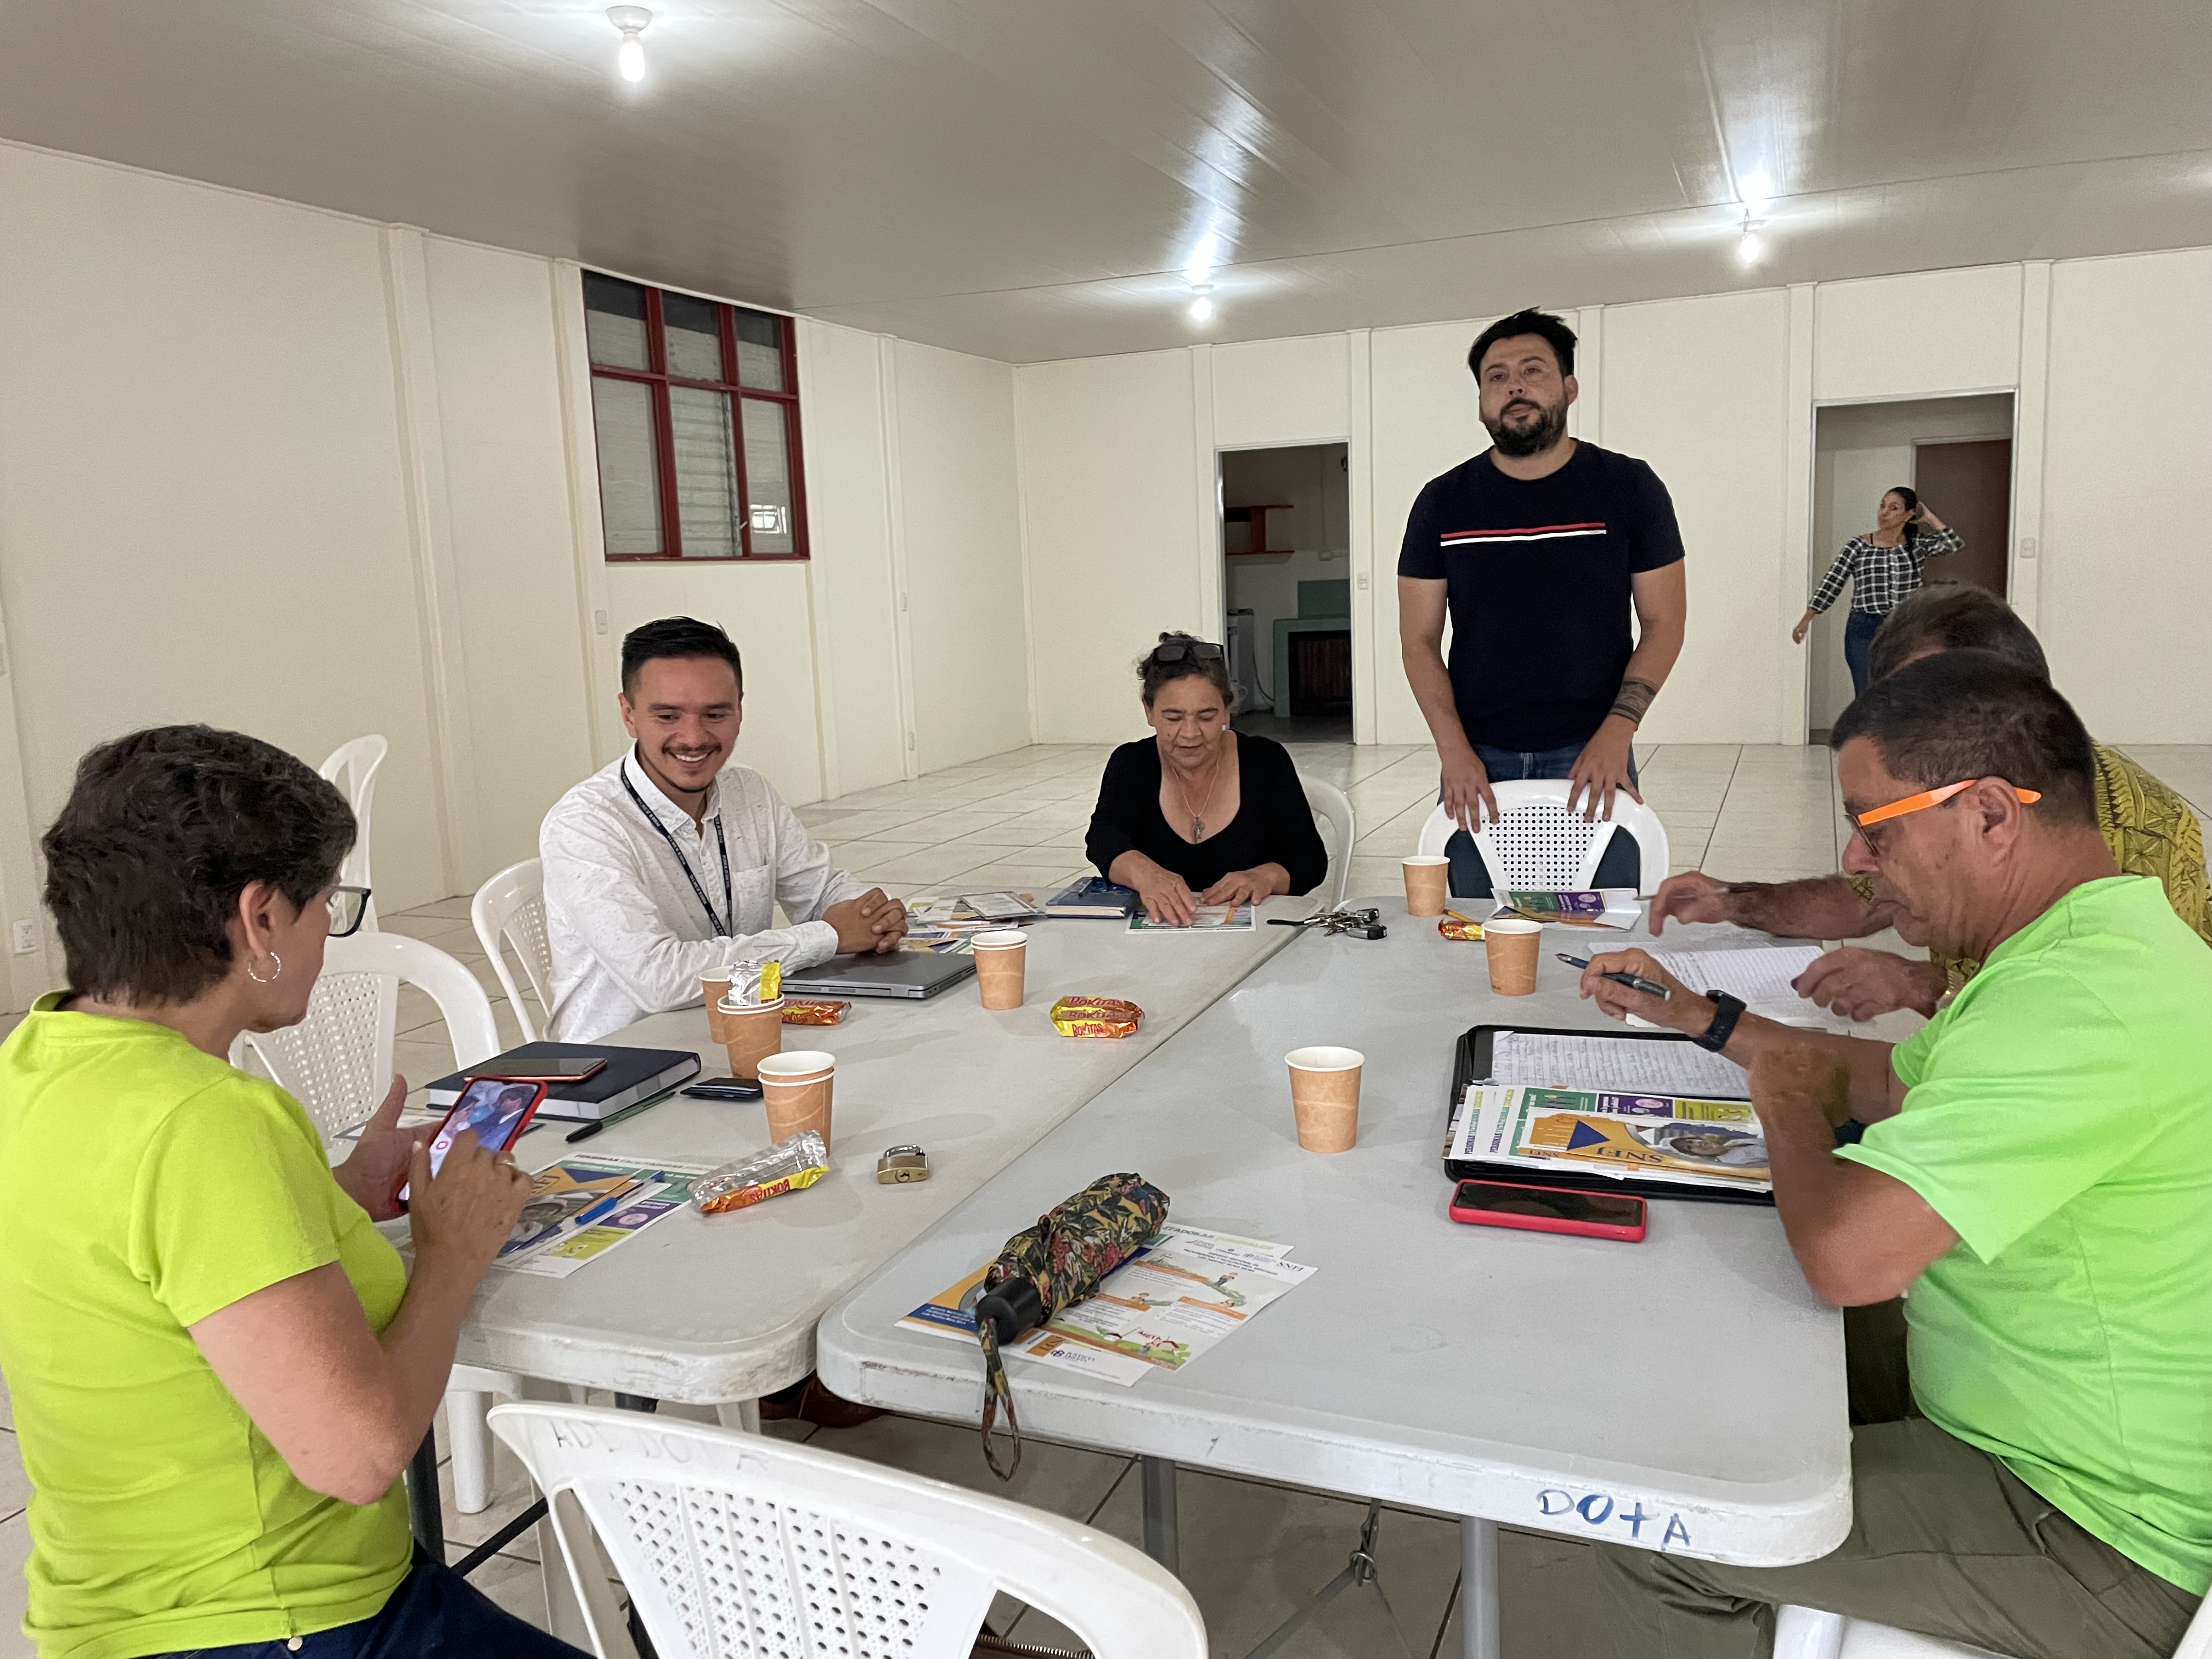
The heart of the expansion was a prioritization model that combined two very different kinds of evidence. On the quantitative side, I collected and analyzed performance data from courts across the country, built institutional performance indicators, and developed a geospatial model to identify the highest-need urban zones. On the qualitative side, I ran participatory workshops and community engagement sessions in each target zone, because administrative data alone couldn’t capture everything that mattered: on-the-ground insecurity, community trust, local capacity. Harmonizing both evidence streams into a single prioritization framework was the analytical core of the project.
Getting the framework adopted required as much stakeholder work as analysis. I worked closely with court administrators to demonstrate the program’s viability and resolve implementation concerns before they became bottlenecks, and I built differentiated communication products for each audience: literature reviews and methodological documentation for technical reviewers, executive-ready policy summaries for senior leadership, and geospatial visualizations paired with data storytelling for frontline staff and community partners. Throughout, I tracked progress against milestones and escalated risks proactively.
The result was a framework that directly guided the expansion, increasing national program coverage by over 15% and the number of active judicial facilitators by 7% within the first six months.
Part of this work, and my broader open-data work at the Judiciary, involved coordinating directly with the IT department to build data visualizations tailored to the Judicial Facilitators Service’s own needs: geo-referenced dashboards showing the volume and type of activities facilitators carried out across the country. The Power BI dashboard below is one of the tools that came out of that collaboration.
Gallery